Features
Assessment should tell you more than a score. Metronome turns every test into evidence you can act on by measuring growth, pinpointing skill gaps, and giving every level of your network the insight it needs, from the classroom to the boardroom.
Unleash the Power of Our SaaS
One connected platform replaces fragmented, single-event testing with a continuous measurement cycle from assessment design and delivery, through AI-assisted grading, to growth analytics and network-wide benchmarking. Consistent standards, comparable results, and actionable insight across every campus, every grade, and every learner.
Growth you can see, skills you can act on
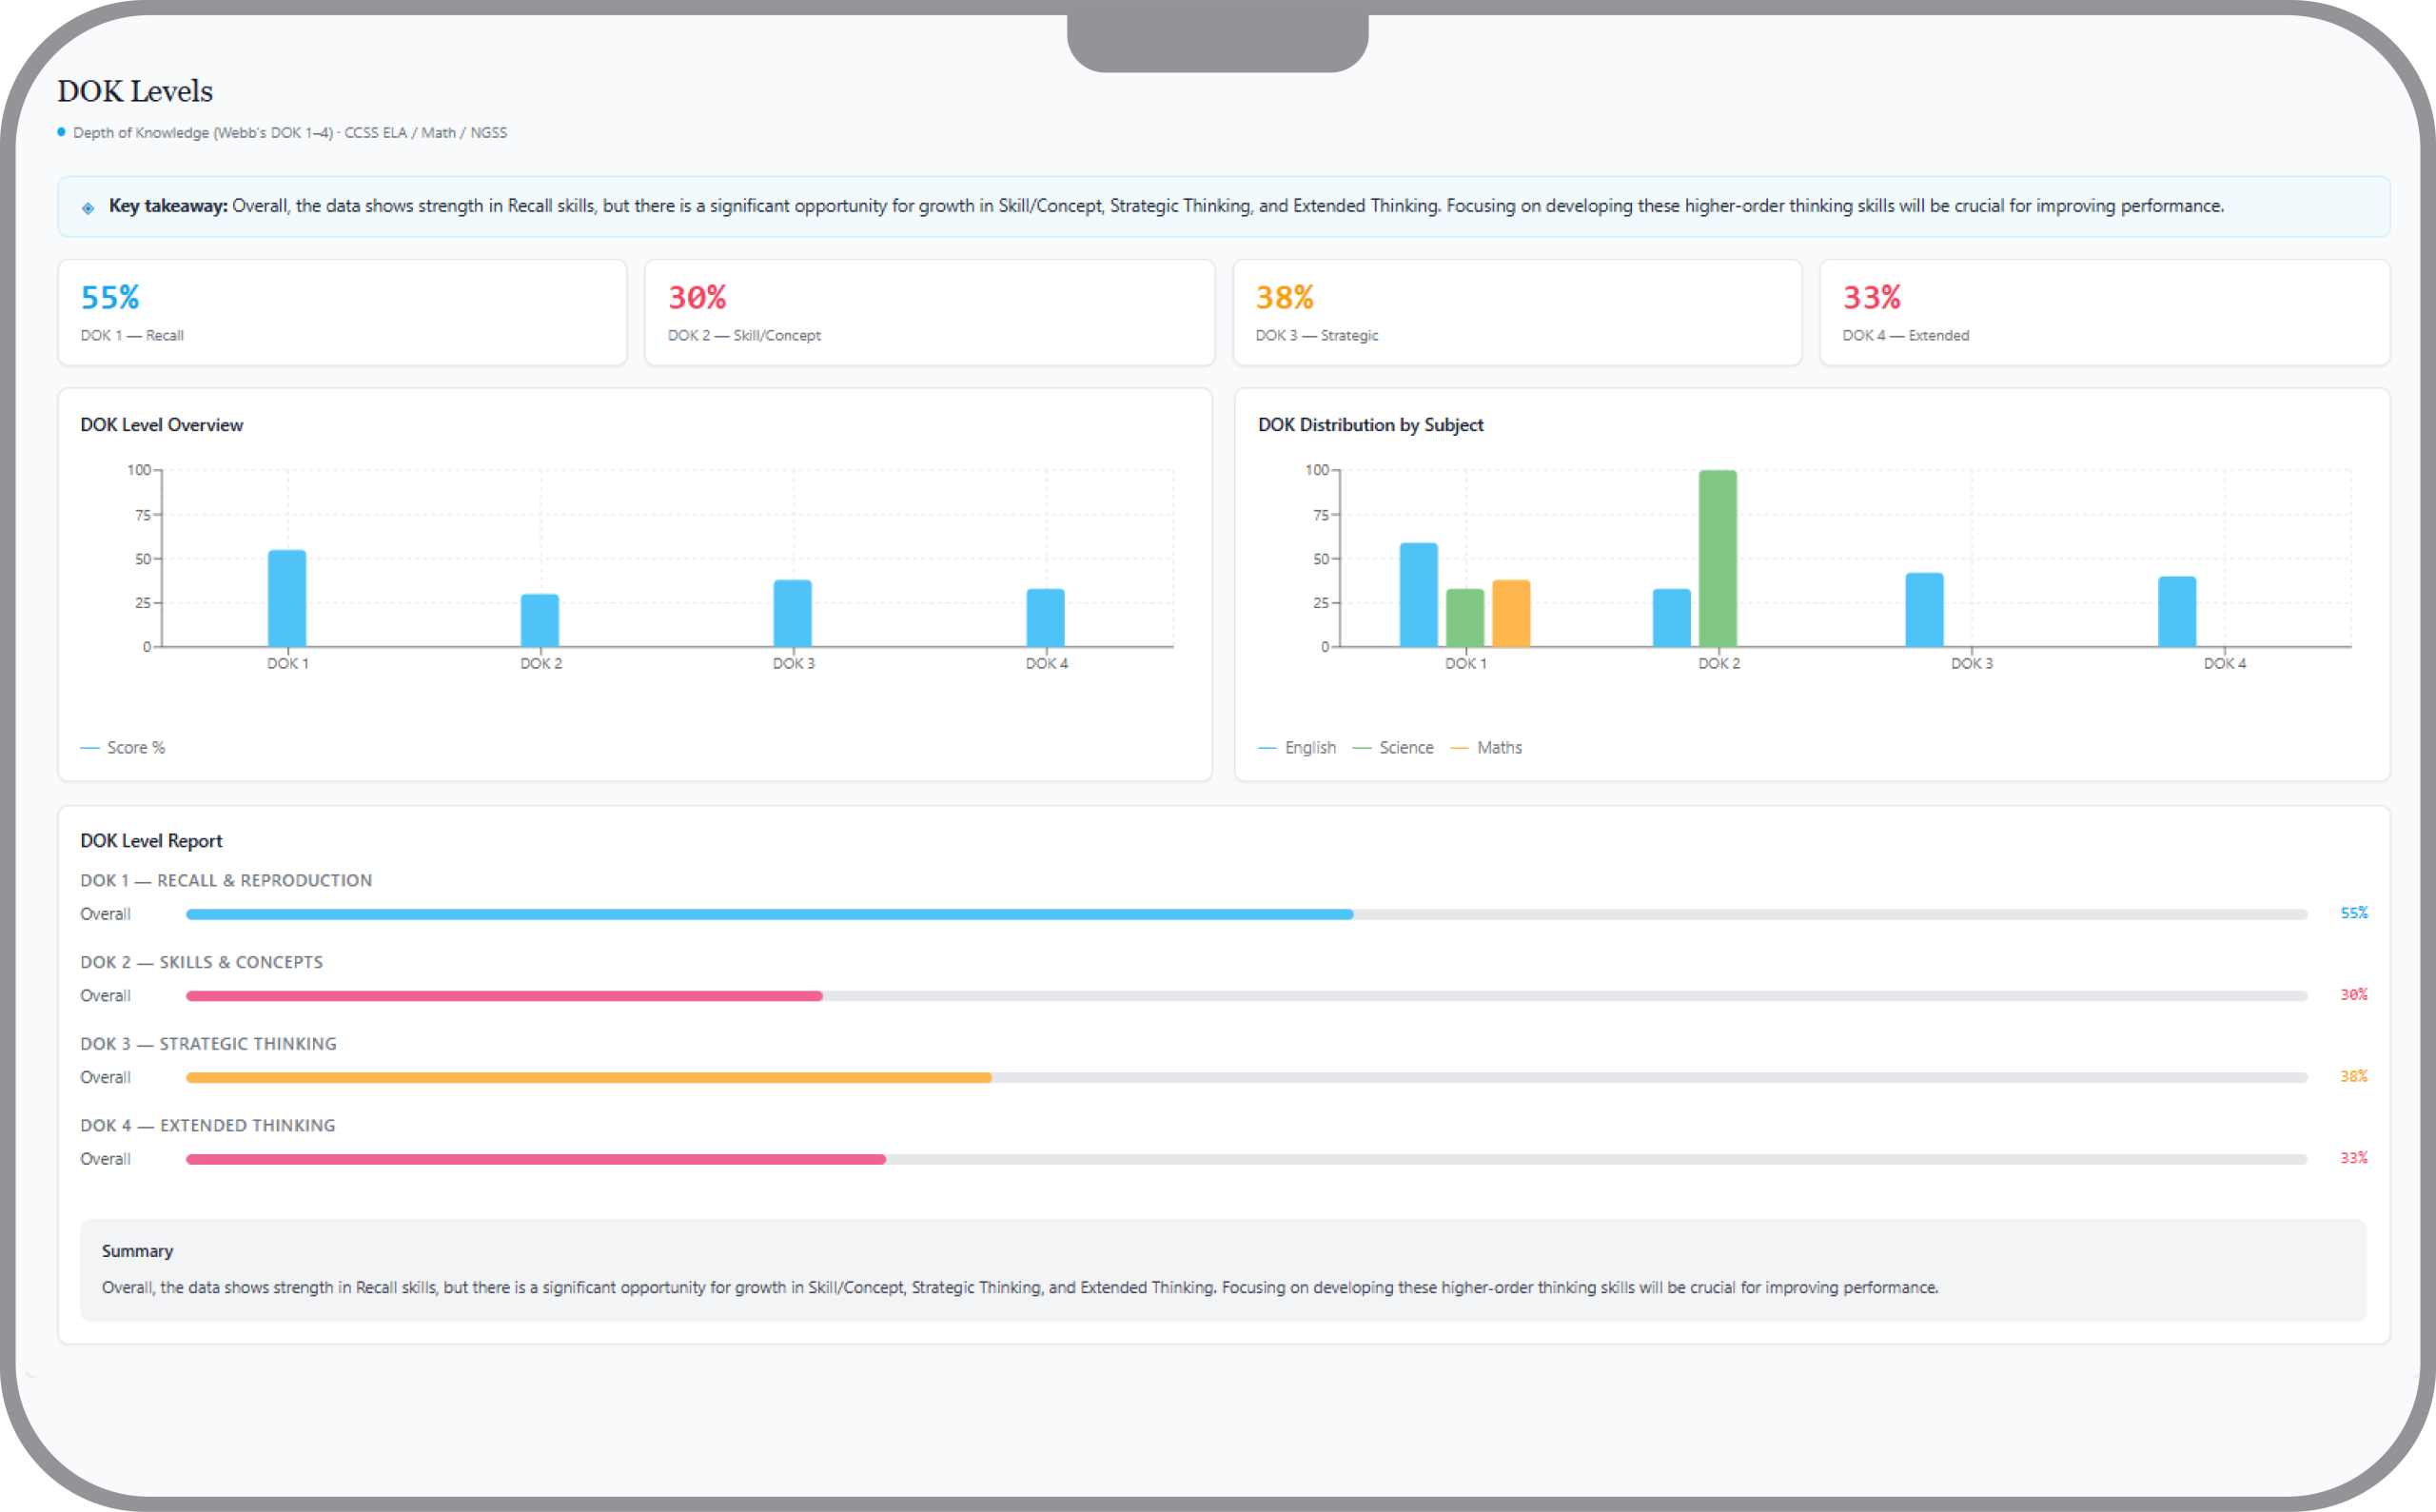
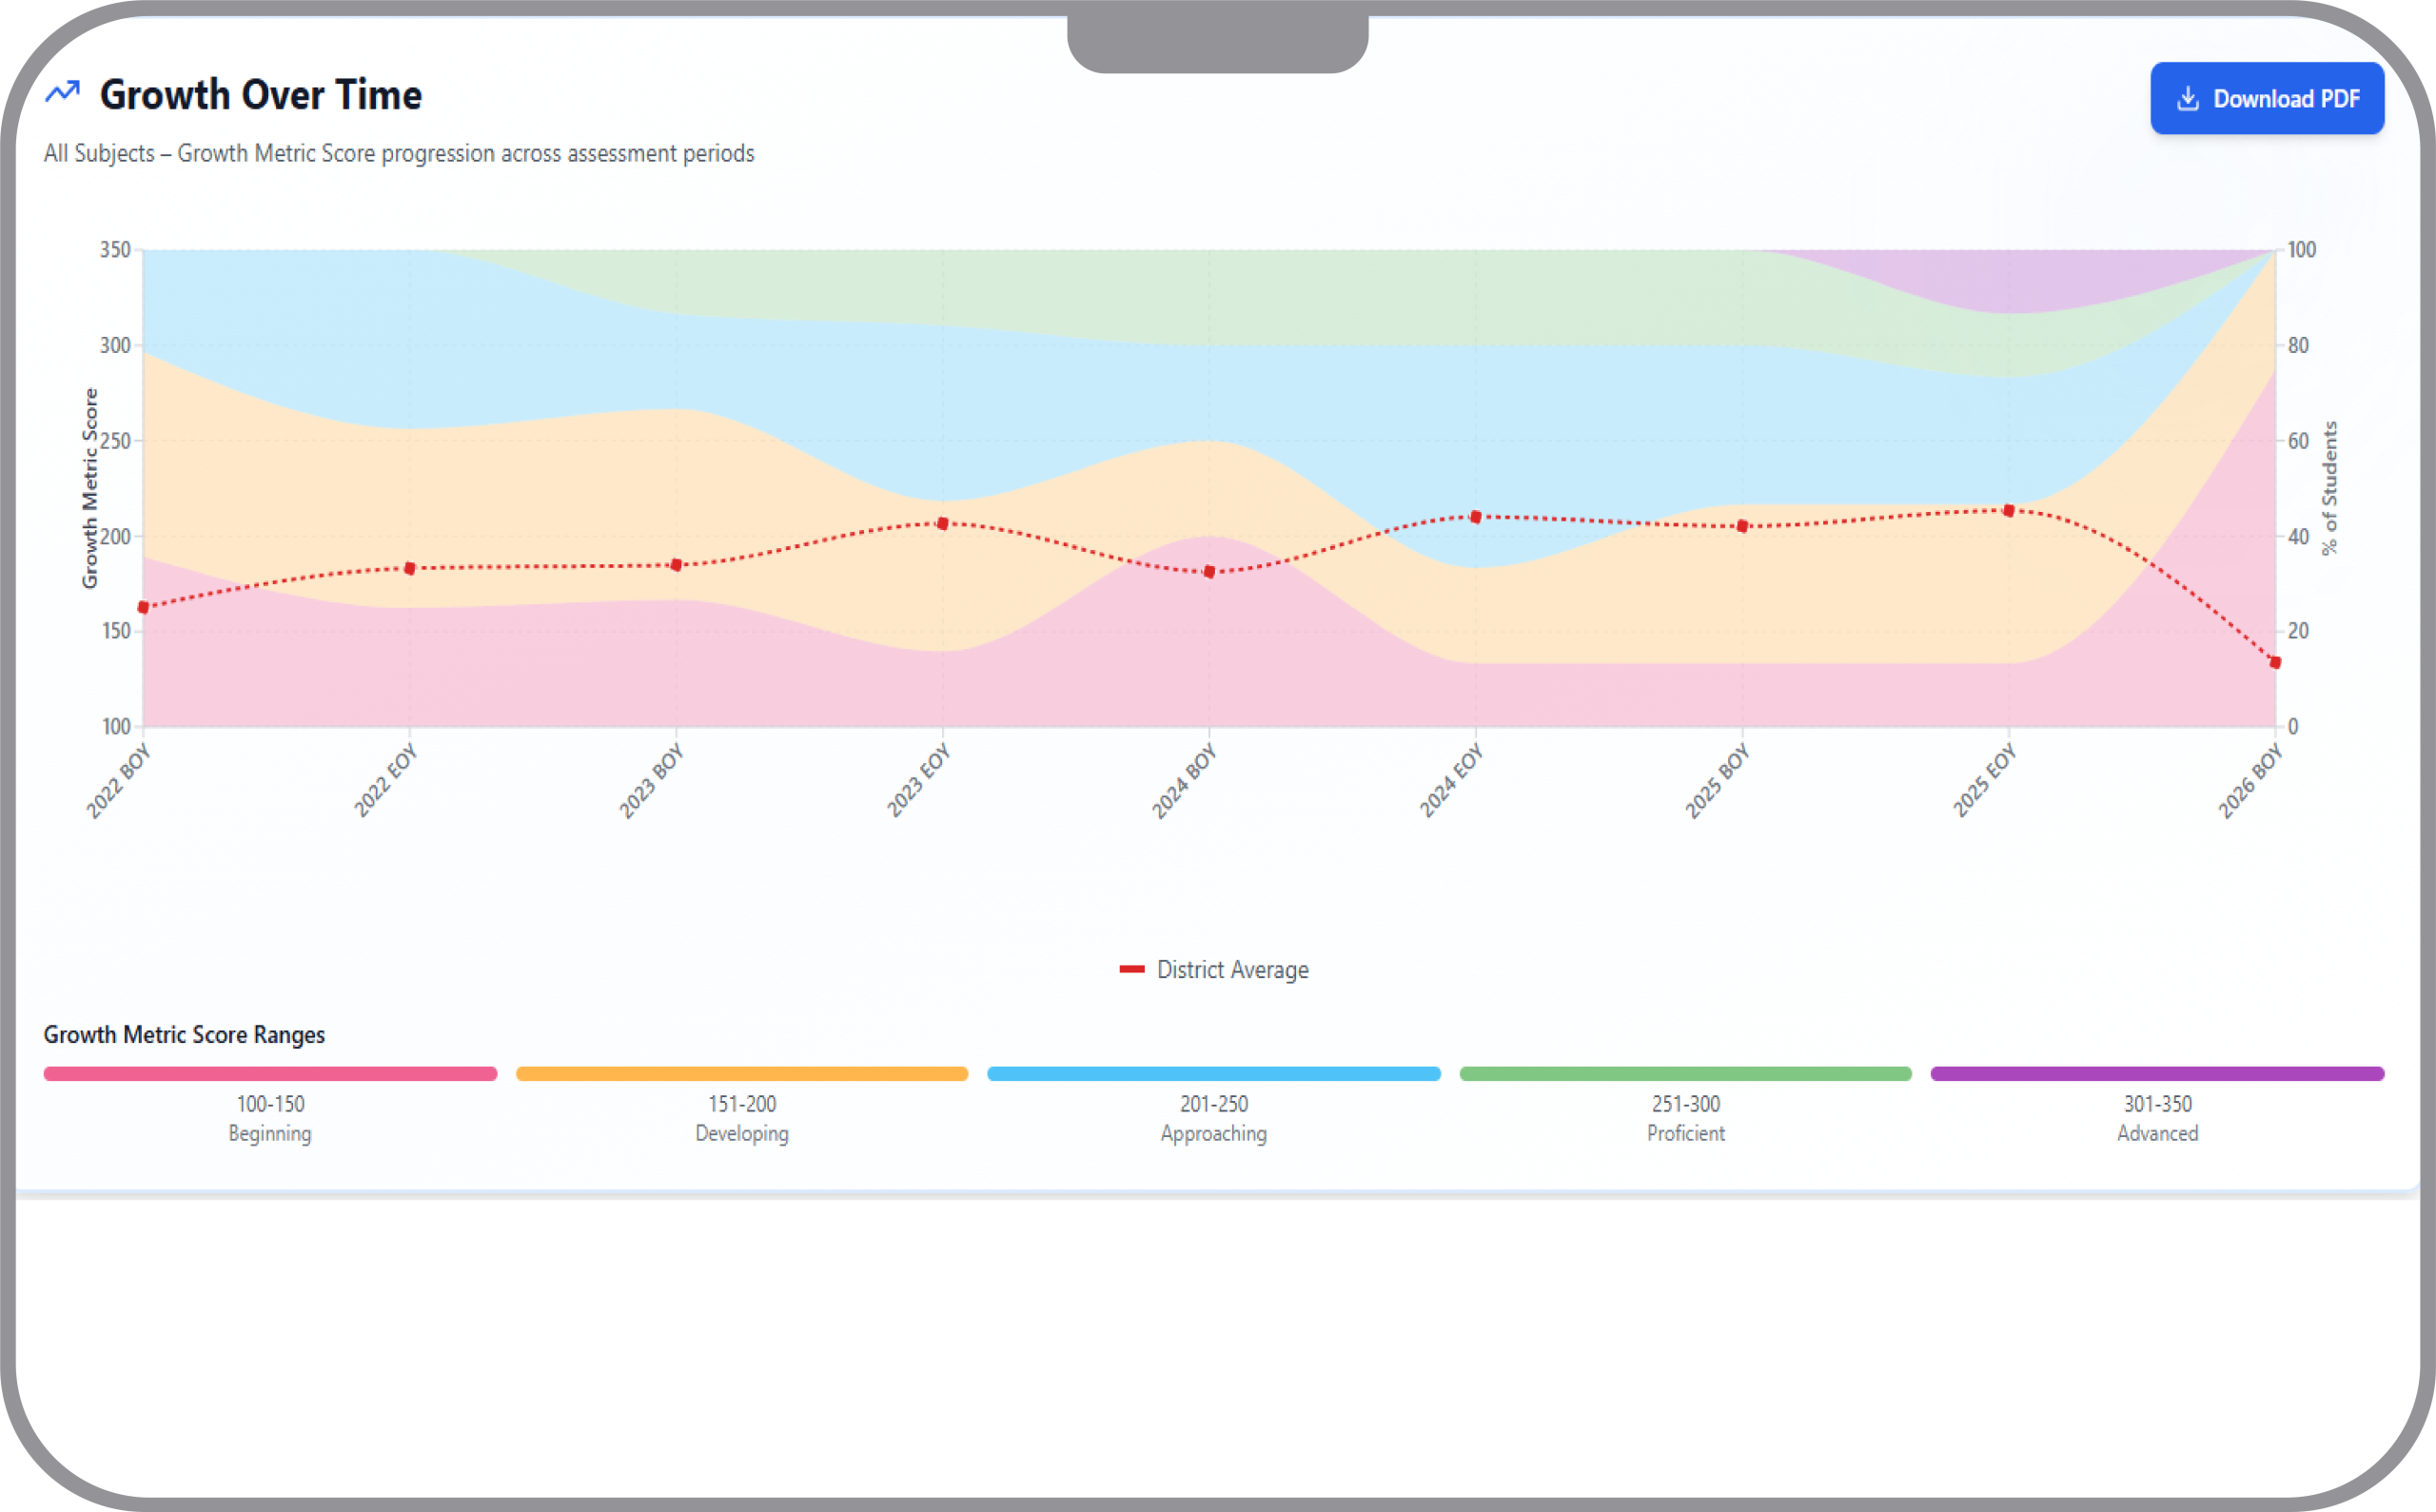
We measure learning across the full arc of a year and across the years that follow, not just at the finish line. Beyond a total score, our reporting shows exactly which competencies are strong and which need work — for a single student, a grade, a school, or the whole network. The result is intelligence leaders can act on, and feedback learners can learn from.
Globally benchmarked, locally grounded
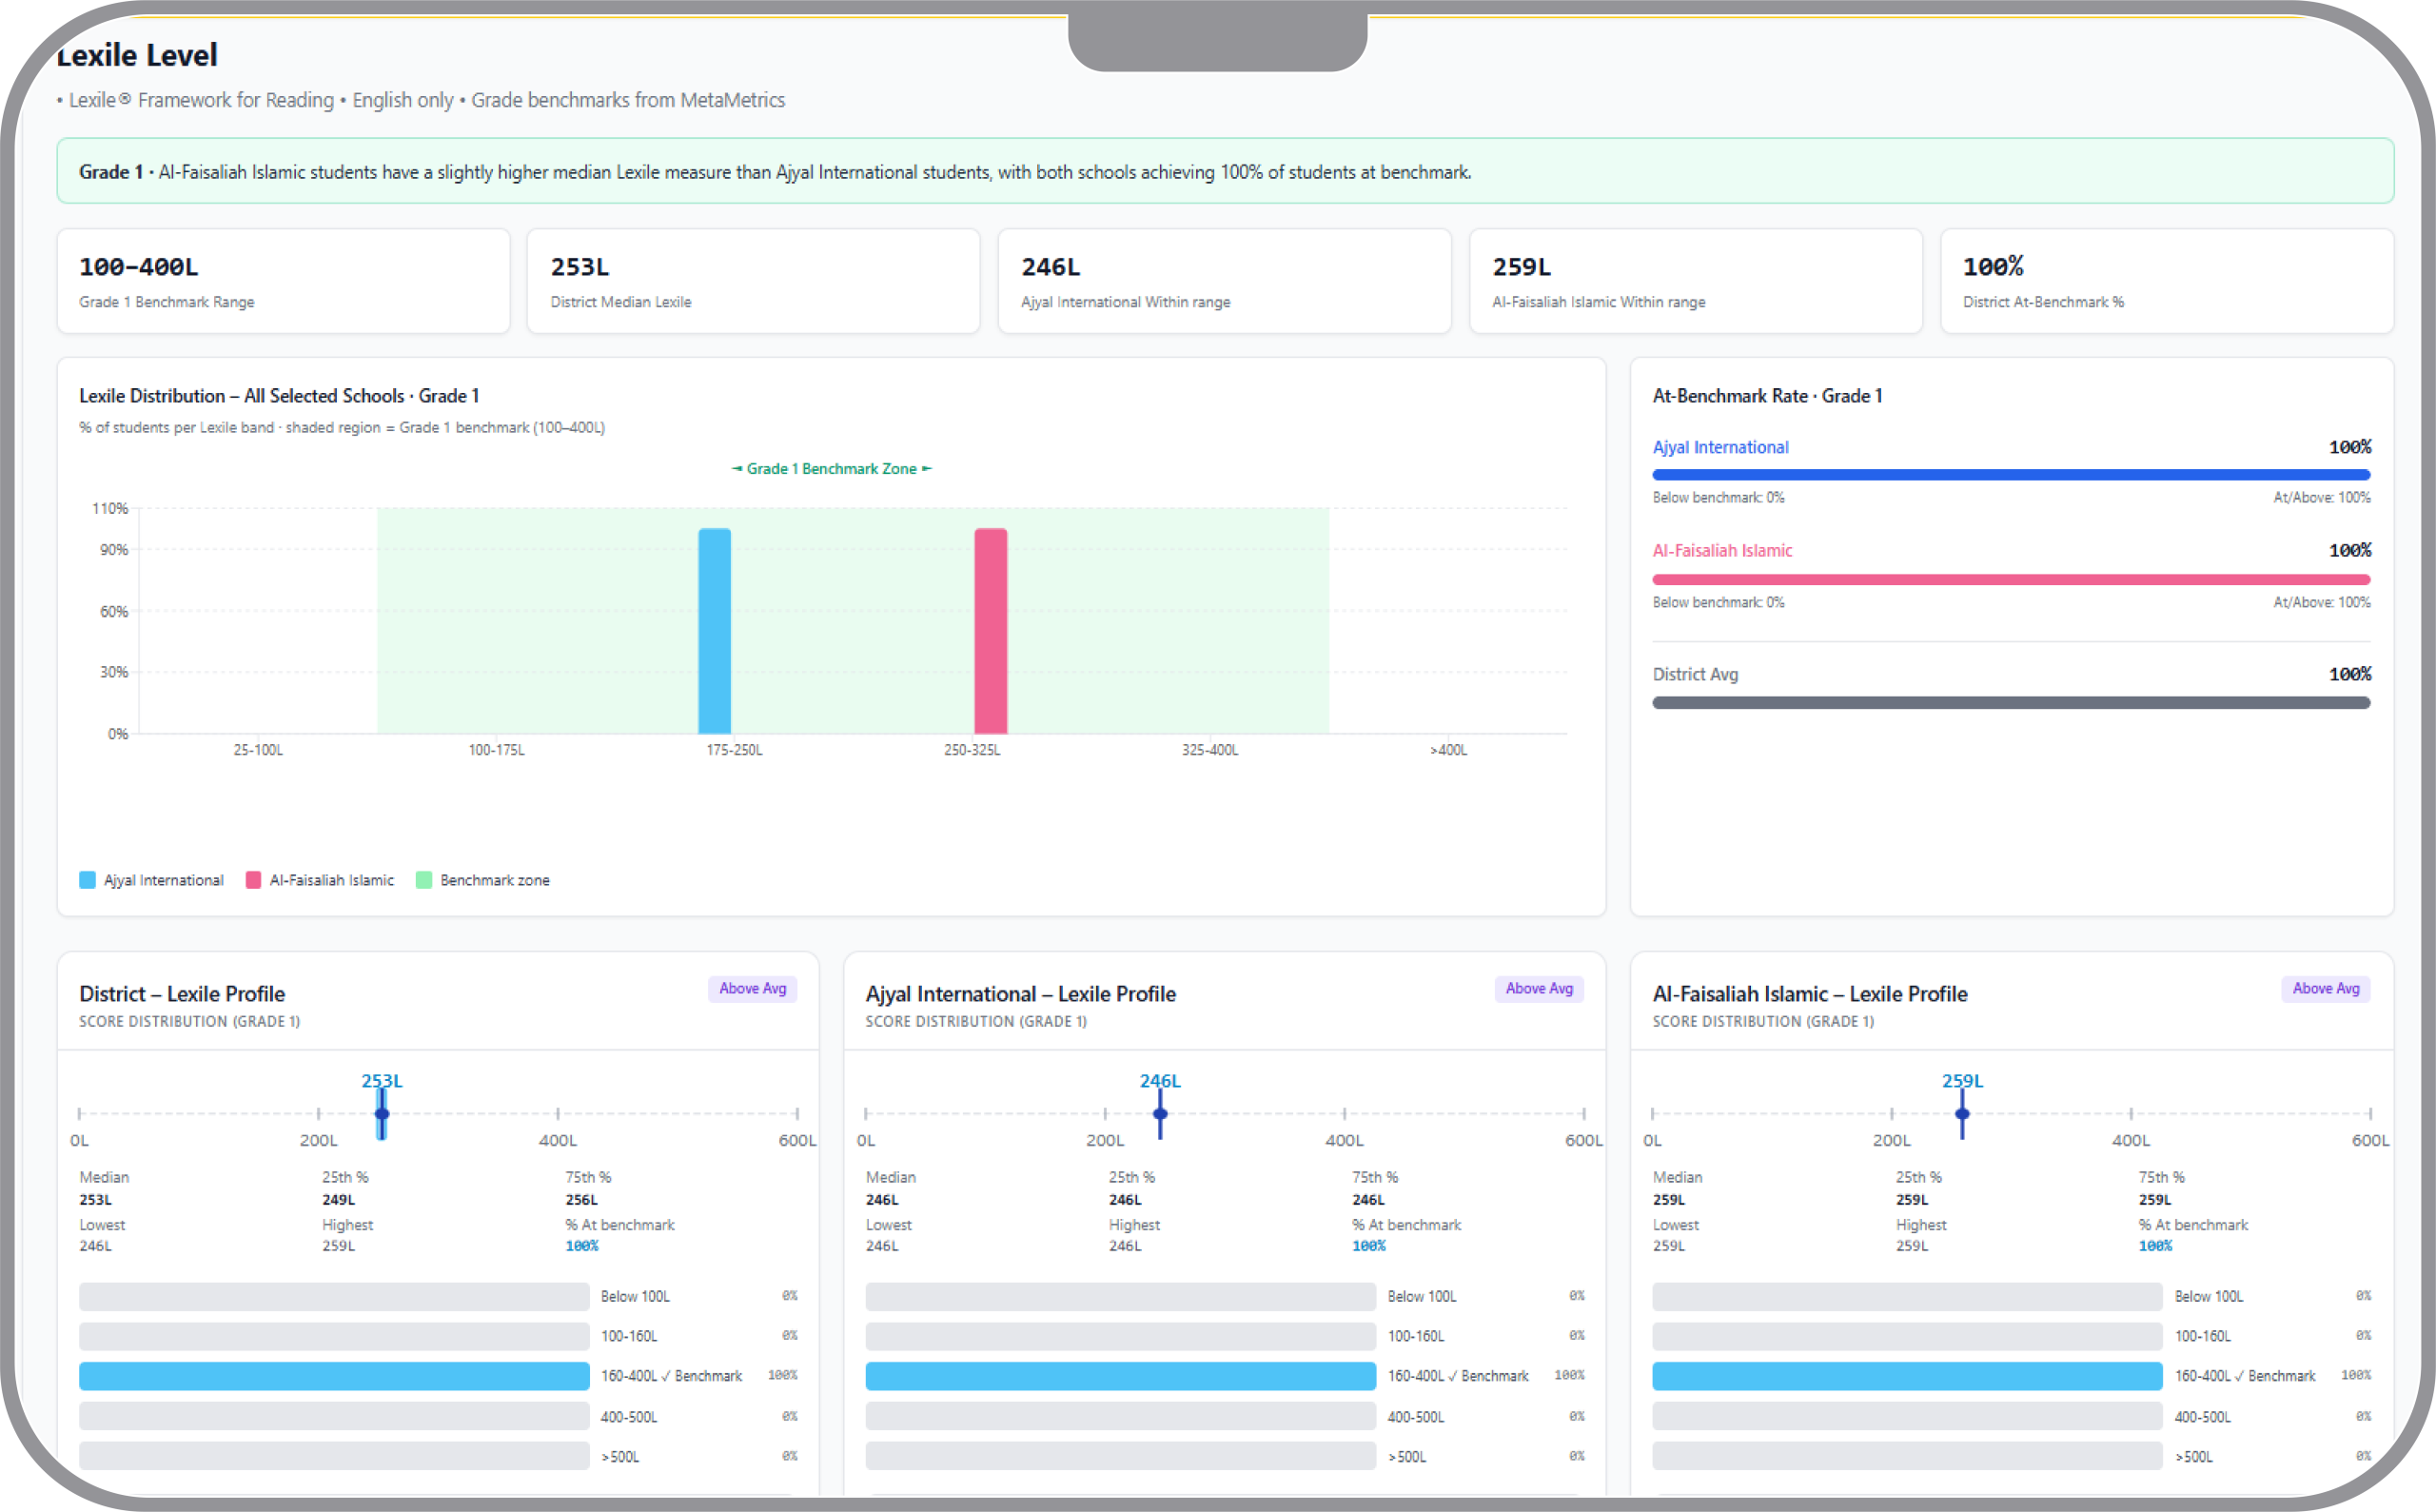
Our academic model is built on internationally recognised frameworks and designed to sit comfortably alongside local curriculum expectations. Whether a campus follows a national, US, UK, or IB context, Metronome adapts its standards, reporting, and language to fit — giving school leaders relevance on the ground and giving regulators results that are credible on any stage.
Every learner, every classroom
We designed Metronome to reach students others leave out — younger grades, invigilated exam halls, and classrooms where connectivity can't be assumed. Assessments work on screen and on paper without compromise, and both flow into the same record for each learner. No student stays invisible to the analytics that shape their education.
Features that make a difference.
Unified Dashboard
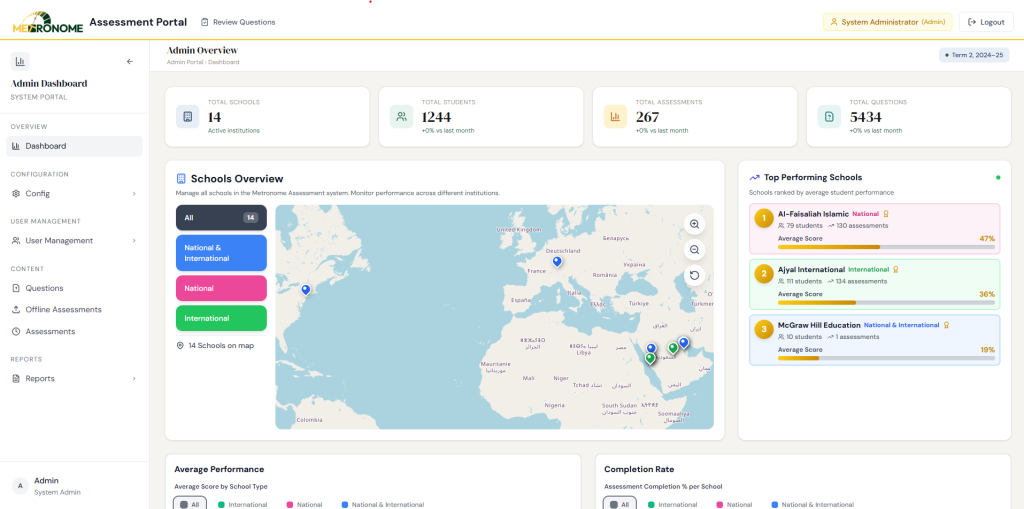
See your whole network at a glance. Role-based dashboards give superintendents cross-campus performance, school leaders their school in context, teachers their class against norms, and learners their own progress where everyone looking at the same evidence through the lens that matches their role.
Advanced Analytics
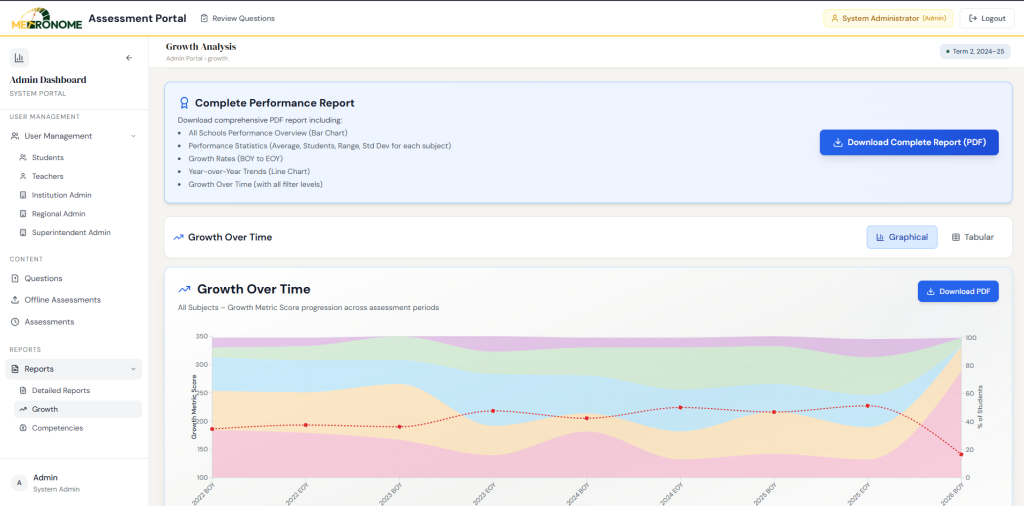
Go beyond the total score. Track learning growth from beginning to end of year and across multiple years, with competency-level breakdowns that show exactly which skills are strong and which need attention, backed by average, range, and standard-deviation reporting fit for board review.
Blueprint & Item Builder
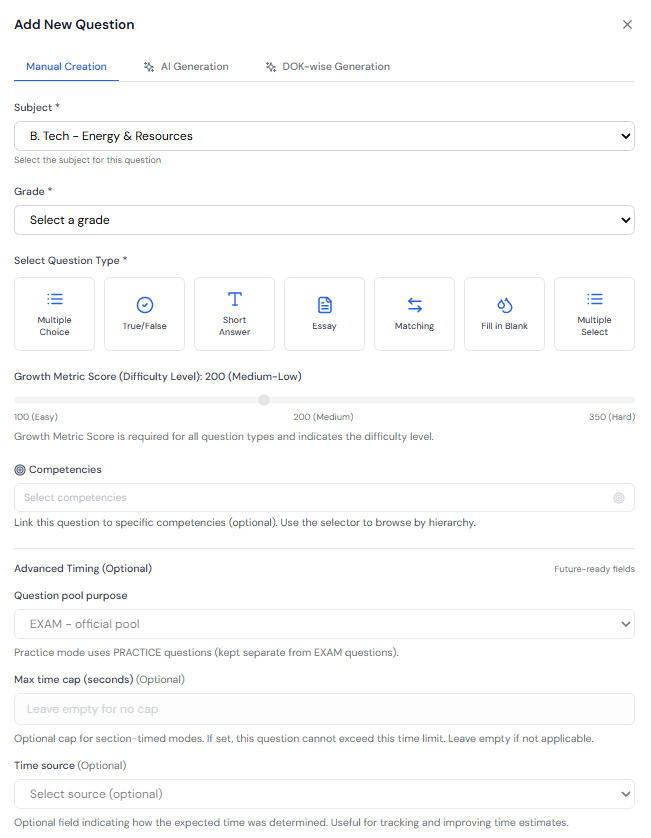
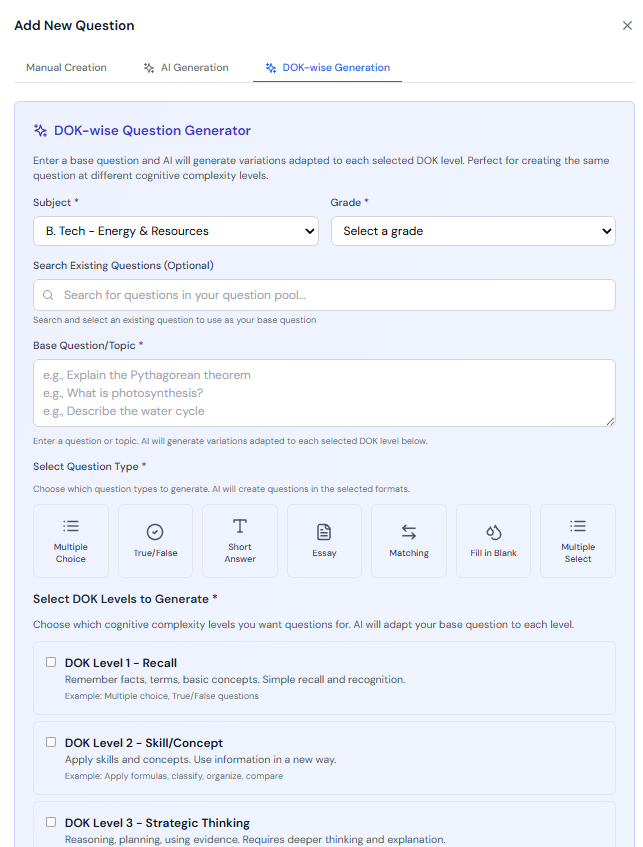
Build assessments with intent. Define requirements by standard, difficulty, DOK level, and competency, and let the blueprint tool suggest matching items with balance warnings that flag gaps before a test goes live. Author, import, or AI-generate items into a governed bank of 18,000+ ready-to-use questions.
Automated Reporting
Turn results into reports automatically. Growth, competency, and comparative reports generate on their own with no manual compilation, so leadership gets board-ready and regulator-ready evidence the moment an assessment closes.
Integrations & SSO
Fit cleanly into your existing systems. Single sign-on and rostering support connect Metronome to your school infrastructure, keeping learner data in sync and removing duplicate admin across the network.
Instant Feedback
Feedback in minutes, not weeks. Adaptive assessments adjust difficulty in real time, and learners receive detailed skill-level feedback and study guidance immediately after submitting, turning every test into a learning tool, not just a final result.
1. Unified Dashboard
Simplify Your Whole Network With One Unified Dashboard
Metronome brings every campus, cohort, and learner into a single view — and gives each decision-maker the lens their role calls for. Superintendents see cross-campus patterns, principals see their school in context, teachers see their class against norms, and learners see their own progress, all drawn from the same underlying data.
Data Ingestion
Results flow in from every source — on-screen assessments, bulk-scanned paper answer sheets, and integrated rostering systems — into a single record per learner. Once ingested, paper-sat and digital-sat results are indistinguishable, so no classroom or cohort stays invisible to the analytics.
Analysis
The dashboard surfaces what matters at a glance: total schools, learners, and assessments; top-performing campuses; average performance by school type; and completion rates across the network — with the ability to drill from network level down to a single learner.
Visualization
Performance is mapped geographically across campuses, charted by school type, and broken out by completion status, letting leadership spot outliers and trends without building a single report by hand.
Use Cases
Board reviews, monthly leadership check-ins, and early identification of campuses drifting below network averages — before a local dip becomes a systemic problem.
2. Advanced Analytics
Measure Real Growth With Our Advanced Analytics Engine
A total score tells you where a learner landed, not how far they travelled. Metronome measures learning across the full arc of a year and across multiple years, so you can see genuine progress and prove whether improvement initiatives are actually working.
Data Ingestion
Every response is tagged to competencies, DOK levels, and standards, and calibrated on the Growth Metric Score — so analysis draws on rich, structured data rather than a single mark.
Analysis
Compare beginning-of-year to end-of-year, track multi-year trends, and benchmark school against school or against the network average. Statistical measures — average, range, and standard deviation — sit alongside growth percentages, making reports credible for board review and regulatory submission.
Visualization
Growth-over-time charts, competency radars, and proficiency distributions make trajectories immediately readable, whether you’re reviewing one learner or the entire network.
Use Cases
Academic strategy reviews backed by longitudinal evidence, performance accountability at school and network level, and directing investment toward the grades and campuses where growth is weakest.
3. Custom Edit Tool Application
Build Better Assessments With Our Custom Item Tools
Metronome puts assessment design under deliberate control. A blueprint tool guides item selection to ensure coverage across standards, competencies, DOK levels, and difficulty — so cognitive rigour and curriculum coverage are intentional, never left to chance.
Data Ingestion
Start from a governed bank of 18,000+ ready-to-use items across English, Math, and Science, Grades 1–12 — every item carrying full metadata and pre-tagged to competencies. Expand it further through manual authoring, CSV bulk import, or AI-assisted generation.
Analysis
Every item moves through a managed lifecycle — Draft, Operational, Rejected, Retired — with a reviewer approval gate for AI-generated content, so nothing unvetted ever reaches a live assessment.
Visualization
As you build, the system flags DOK or difficulty imbalance and suggests alternative items, then previews the finished assessment before you export it to a print-ready PDF.
Use Cases
Creating fair, comparable benchmark tests across campuses; building progressive difficulty across DOK levels; and growing an owned, auditable assessment asset over time.
4. Automated Reporting
Turn Results Into Reports With Automated Reporting
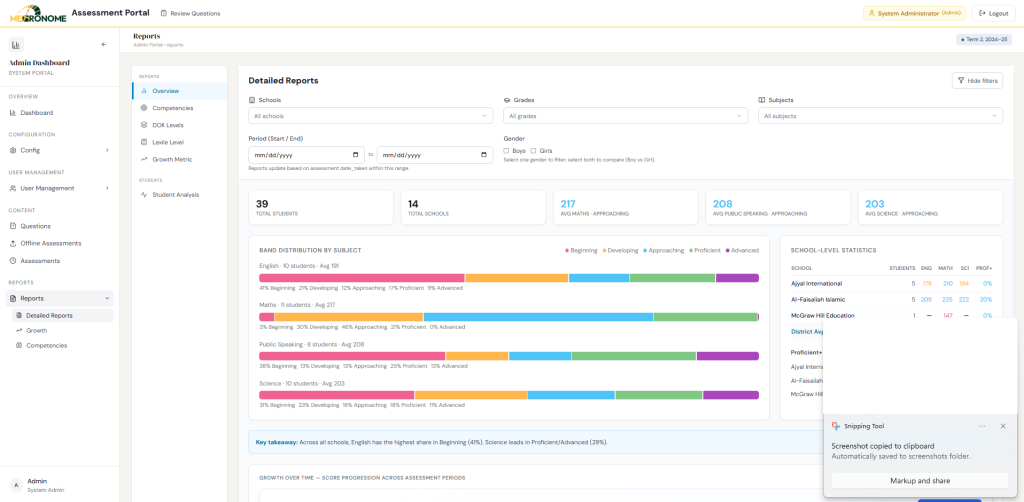
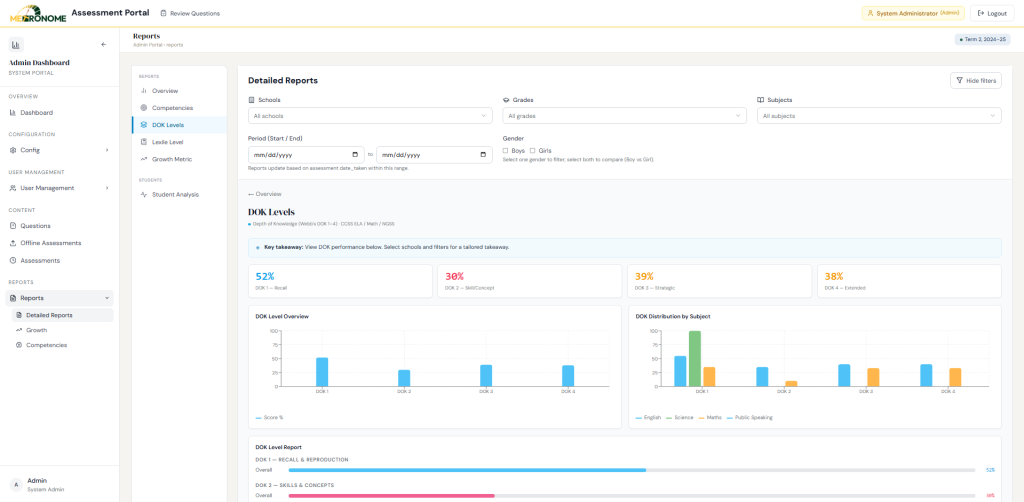
Reporting shouldn’t mean chasing spreadsheets. Metronome generates growth, competency, and comparative reports automatically from the same assessment data — no manual compilation, and no separate reporting stream for paper versus digital.
Data Ingestion
Every completed assessment feeds directly into the reporting engine, combining scores, competency tags, and growth calculations into one consistent dataset across the network.
Analysis
Reports answer leadership’s core questions: Is learning improving? Which schools are accelerating? Which grades need support? Competency reports show how many learners fall into Proficient, Developing, or Struggling bands — by school, grade, year, and subject.
Visualization
Growth trends, proficiency distributions, and comparative rankings are rendered in clear, shareable formats suitable for classroom use and board packs alike.
Use Cases
Regulatory submissions, quarterly leadership reviews, and targeted remediation planning grounded in actual student data rather than averages.